The Easiest Computational Fluid Dynamics Software
 JP
JP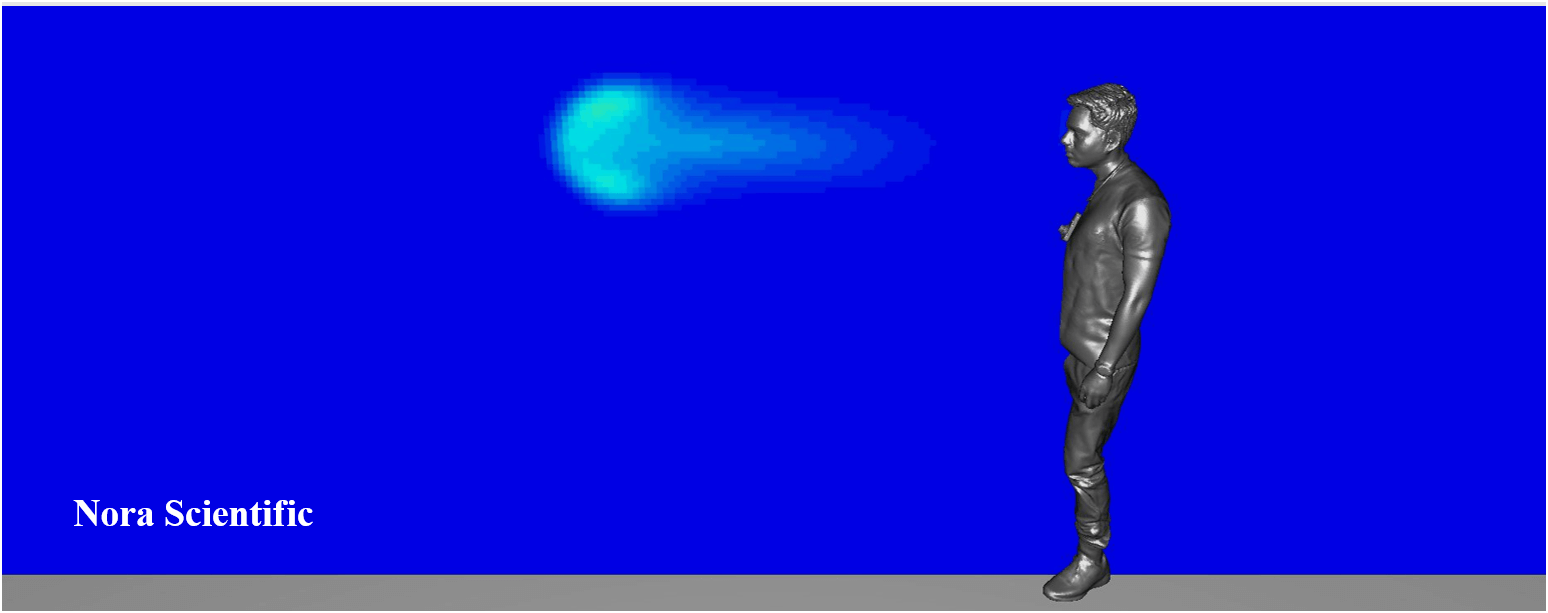
Simulation of Cough Droplet Dispersion
1. Introduction
Cough is considered as one of main mechanisms by which various viruses are transmitted from person to person. We will simulate how the gas (airborne droplets) from lungs and throat spread from coughing.
Here, we will use a human model (STL) freely downloadable from GRABCAD. If the link does not work, you can also download the same STL file from here.
Before performing simulation, please adjust the scale of the STL model (in the original file the height is inappropriate). You may refer to "3D CAD Model and its Optimization". An optimised STL file is included in the below input files.
All the input files required for this simulation can be downloaded from below. Should you choose to download the zip file, you need to unzip the file, and store the unzipped files in somehwere under FSP directory or subdirectory.
**You need to change "param_0.txt" and "param_100.txt" to "param.txt" accordingly before the simulation with each inputs.
Input files
- param_0.txt (from 0 to 100th step; for initial phase; change the name to "param.txt")
(for 2022R3.1 or earlier version, use this) - param_100.txt (after 100th step; for mid-phase; change the name to "param.txt")
(for 2022R3.1 or earlier version, use this) - bcXY0.bmp
- bcZX0.bmp
- bc.stl
A typical computational time of this case is approximately 20 minutes per 1000 time steps with a typical Core i7 PC with the maximum parallelism setting (parallel in parameter setting).
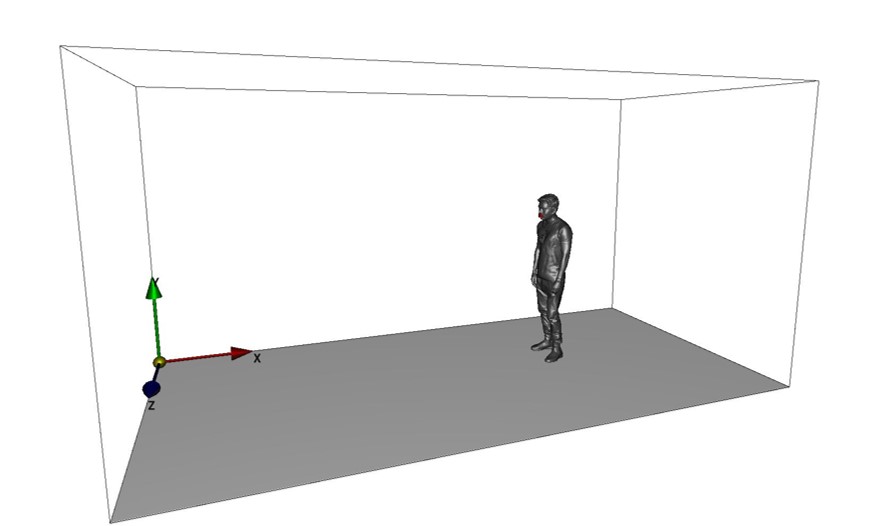
2. Domain configuration
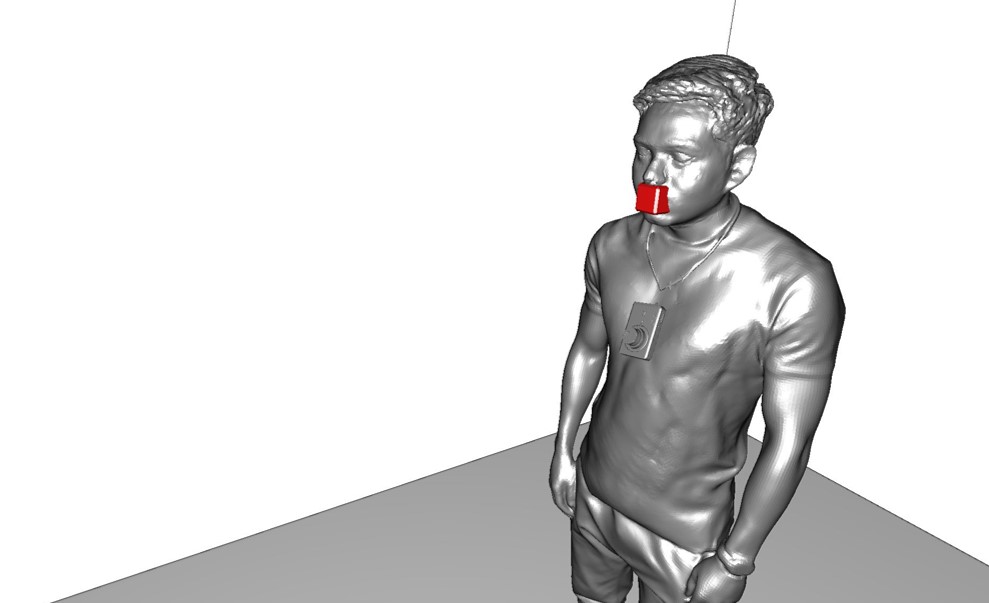
In the persent simualtion configuration, the human model with height of approximately 190cm stands on the left side of the domain, and there is a red boundary at its mouth. The human model is based on STL file, and the red boundary is constructed by bitmap images. Several iterations are necesary to match the position and size of the red boundary and the mouoth position of the human model (in the above input files, these positions are adjusted).
3. Simulation Parameters
Below explains several important aspects of the present simulation example. General description of parameters in Flowsquare+ are explained in here.
Some of the simulation parameters are different for the initial phase (from 0 to 100th time step) and mid-phase (after 100th time step). Differences are explained in below.
For the initial phase
For the initial phase, left-ward initial velocity of -55m/s (200km/h) is specified for the red boundary. Cough is a process which takes some time. Therefore, in the present simulation, we assume cough produces the inflow velocity (-55m/s) of the gas from the lungs and throat (airborne droplets) for 100 time steps.
Also, the mass fraction of the inflow gas from the mouth is taken as 1. The fluid velocity due to coughing is, with a relatively large uncertainty, usually considered to be somewhere between 200 to 400 km/h.
- cfl = 0.25
- uinR = -55 m/s
- vinR = 0.0 m/s
- winR = 0.0 m/s
- massfrR = 1.0 m/s
For the mid phase
After the initial phase (after the cough), the red boundary must not influence the fluid field. Therefore, the inflow parameters (uinR, vinR, winR and massfrR) are specified as "-" (hyphen). By doing so, the red boundary has no effect on the fluid field. Instead of changing these parameters you can also remove red boundary from the bitmap images.
A smaller CFL number is specified for the mid phase. This is to include the diffusion effect in CFL criterion due to decreasing velocity magnitude over time.
- cfl = 0.10
- uinR = -
- vinR = -
- winR = -
- massfrR = -
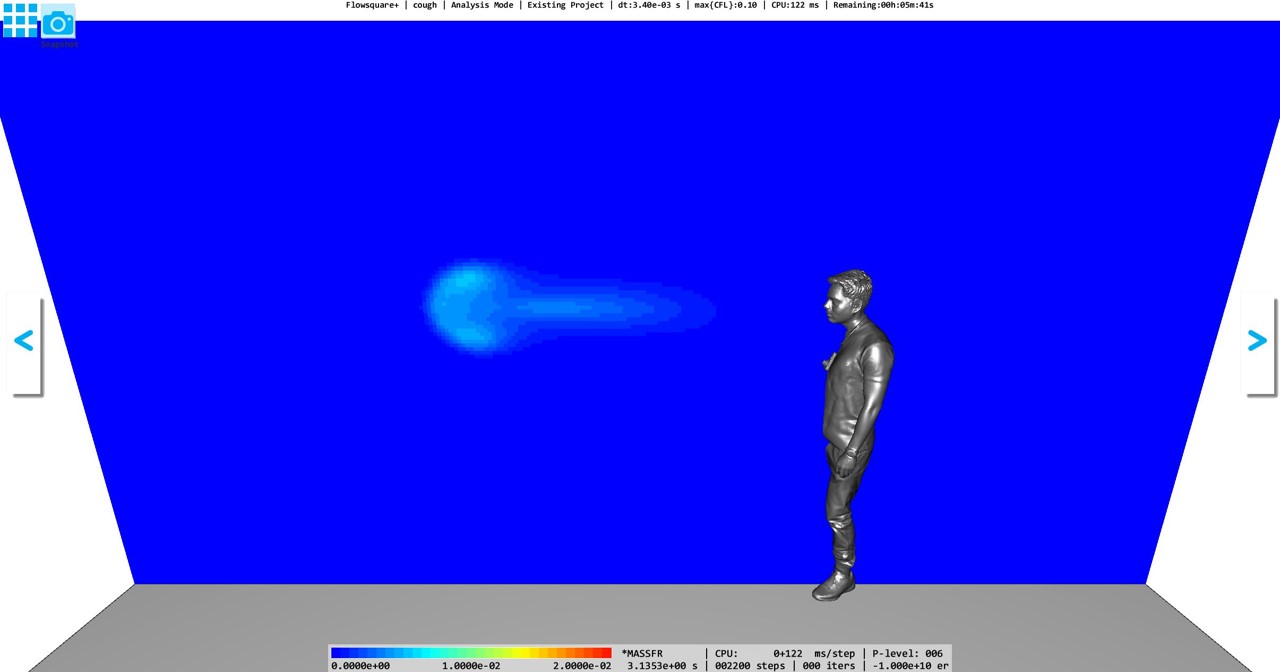
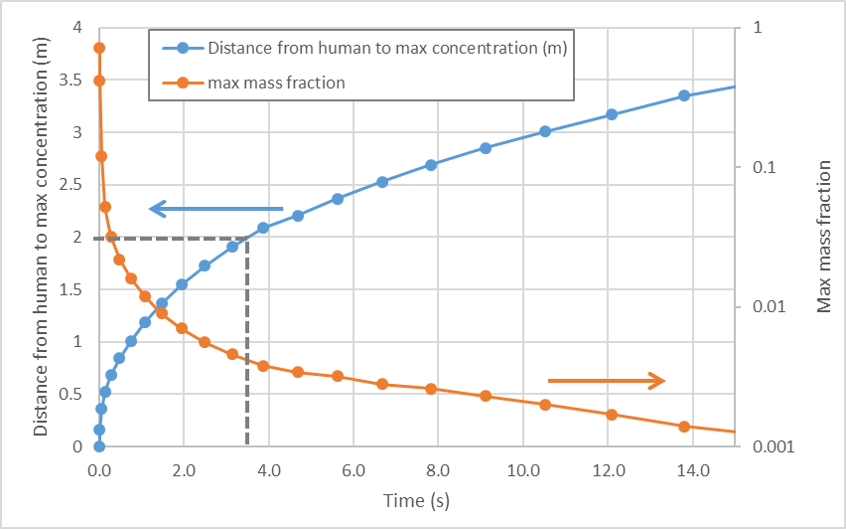
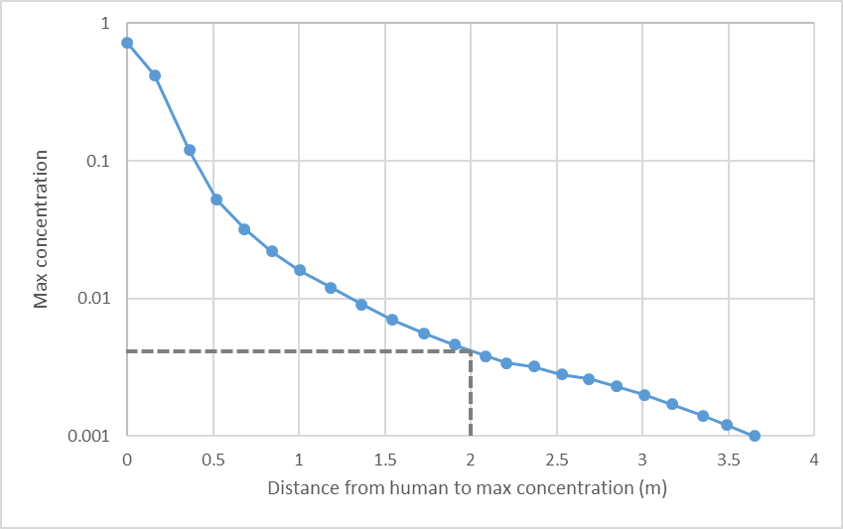
4. Simulation results
The below figure shows an instantaneous mass fraction of the gas came out from the mouth (therefore concentration of airborne droplets). Approximately 3 seconds after the cough, the high droplets region travels horizontaly for about 2 meters, and the mass fraction decreases to below 1% (1.0E-02). As shown in the below movie, after 3 seconds, the travel of the high droplet region becomes slower, and decrease of the concentration becomes more gradual.