The Easiest Computational Fluid Dynamics Software
 JP
JP
Visualization Related Parameters
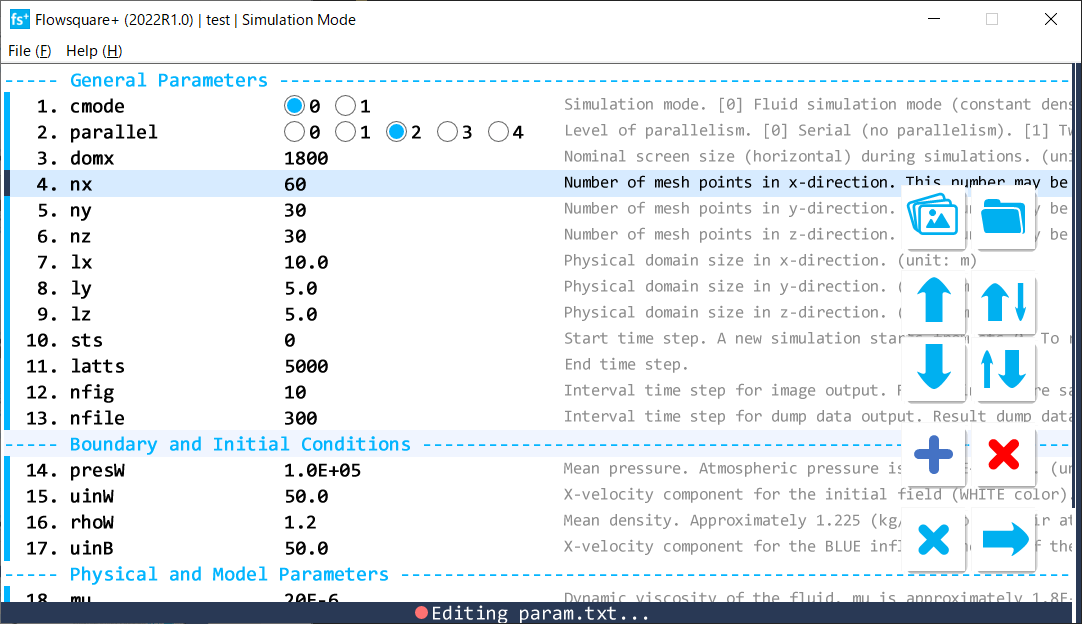
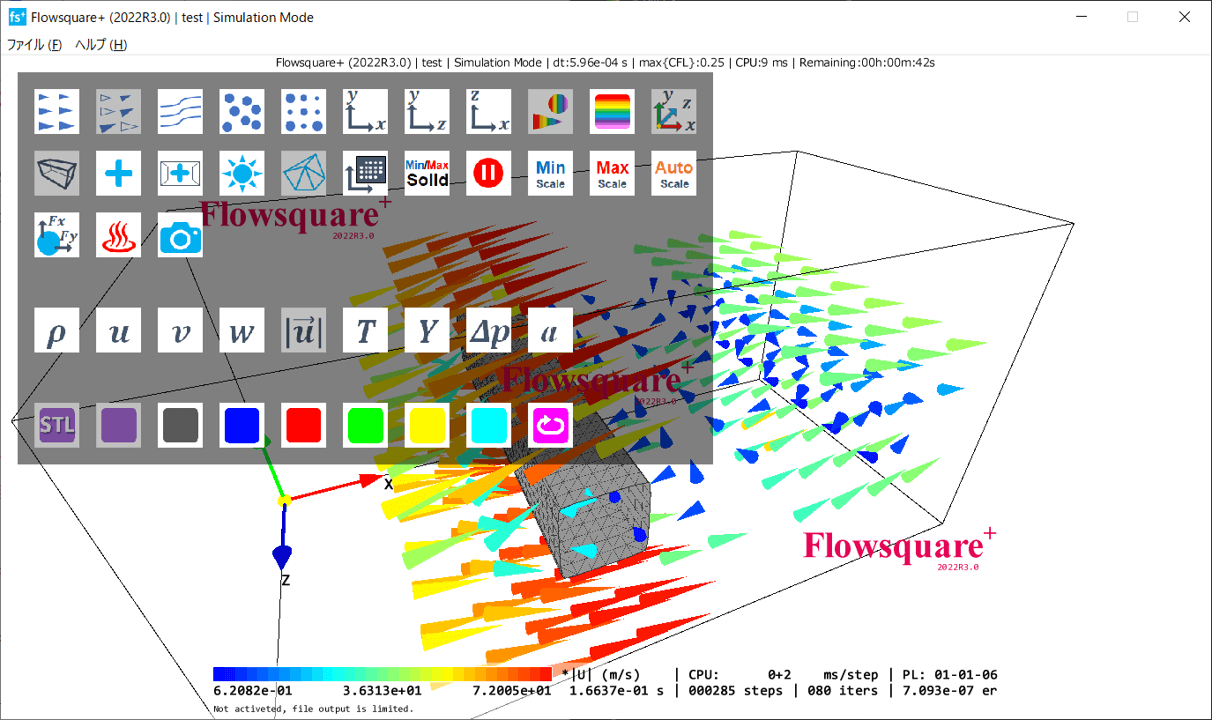
In Flowsquare+, all important parameters related to simulation methods and conditions are specified through the parameter editor and saved in param.txt. Also, most of visualization tools can be controlled on the tool pane. These interfaces are described more detail in here.
Here, Flowsquare+ has additional visualization features that are not controlled on the tool pane. Such features can be accessed by manually editing viz.txt generated automatically under the input directory and loaded at the beginning of each simulation.
All the parameters set in viz.txt controls only visualization and they do not influence the simulation solution itself. Also, parameters modified via the tool pane are stored in viz.txt at every file operation (figure output, dump file output) during the simulation. Deleting viz.txt file resets the visualization setting based on default values (the values in the bracket [] below items).
Visualization related parameters in viz.txt
- useLightingFlag [0]
This parameter can also be modified by on the tool pane, and it controls 3D lighting.
(0: off, 1: on) - polygonFrames [1]
This parameter can also be modified by on the tool pane, and it controls polygon frame visualization.
(0: off, 1: on) - showOutlineFlag [1]
This parameter can also be modified by on the tool pane, and it controls visualization of the domain outline.
(0: off, 1: on) - showOrientationAxesFlag [1]
This parameter can also be modified by on the tool pane, and it controls visualization of the orientation axes.
(0: off, 1: on) - showCameraTargetFlag [0]
This parameter can also be modified by on the tool pane, and it controls visualization of the camera target.
(0: off, 1: on) - showBoundaryFlagUser [1]
This parameter can also be modified by on the tool pane, and it controls visualization of non-preset color based boundary conditions.
(0: off, 1: on) - showBoundaryFlagBlack [1]
This parameter can also be modified by on the tool pane, and it controls visualization of preset black color based boundary conditions.
(0: off, 1: on) - showBoundaryFlagBlue [0]
This parameter can also be modified by on the tool pane, and it controls visualization of preset blue color based boundary conditions.
(0: off, 1: on) - showBoundaryFlagRed [0]
This parameter can also be modified by on the tool pane, and it controls visualization of preset red color based boundary conditions.
(0: off, 1: on) - showBoundaryFlagGreen [0]
This parameter can also be modified by on the tool pane, and it controls visualization of preset green color based boundary conditions.
(0: off, 1: on) - showBoundaryFlagYellow [0] [2021R1.0 or later]
This parameter can also be modified by on the tool pane, and it controls visualization of preset yellow color based boundary conditions.
(0: off, 1: on) - showBoundaryFlagCyan [0] [2021R1.0 or later]
This parameter can also be modified by on the tool pane, and it controls visualization of preset cyan color based boundary conditions.
(0: off, 1: on) - showBoundaryFlagSTL [1]
This parameter can also be modified by on the tool pane, and it controls visualization of CAD (STL) based boundary conditions.
(0: off, 1: on) - showQColorOnBoundaryFlag [0]
This parameter can also be modified by on the tool pane, and it controls colouring boundary conditions based on the current physical quantity.
(0: off, 1: on) - showVectorFlag [1]
This parameter can also be modified by on the tool pane, and it controls visualization of the velocity vector.
(0: off, 1: on) - showCorrVectorFlag [0]
This parameter can also be modified by on the tool pane, and it controls visualization of the uncorrelated velocity vector (velocity vectors that are uncorrelated with blue inflow velocity).
(0: off, 1: on) - corrVectorThres [0.99]
If the correlation coefficient of blue inflow velocity and a local velocity vector is below corrVectorThres, the velocity vector is displayed as an uncorrelated velocity vector. - miniVecSizeScaling [0.2]
The size of visualized velocity vectors in Flowsquare+ depends on the magnitude of each local fluid velocity. This parameter controls the minimum size of velocity vector (that corresponds to a vector with the smallest velocity magnitude). - showTracerParticleFlag [0]
This parameter can also be modified by on the tool pane, and it controls visualization of tracer particle.
(0: off, 1: on) - numTracerParticles [2000]
This corresponds to the total number of tracer particles. Feeding rate of the particles are automatically adjusted accordingly. - particleFeedInterval [50] [2023R3.0 or later]
Timestep interval at which the tracer particles are additionally fed in the domain. - showContourPaticlesFlag [0]
This parameter can also be modified by on the tool pane, and it controls visualization of contour particle.
(0: off, 1: on) - particleSize [0.1]
This parameter controls the size of tracer and contour particles. The size is approximately ndiv times mesh size (ndiv is specified in the parameter). - particleDivNum [8]
This parameter controls the polygon resolution of tracer and contour particles. - particleVelocityMultiple [1.0] [2023R3.0 or later]
This coefficient is multiplied by the velocity of the tracer particles. A value of 1.0 or higher is used when the local fluid velocity where the tracer particles are located is very small, for example, to make it easier to confirm the motion of the tracer particles. Note, however, that if a value greater than 1.0 is used, the motion of the tracer particles does not strictly follow the fluid flow. - showStreamlineFlag [0]
This parameter can also be modified by on the tool pane, and it controls visualization of streamline.
(0: off, 1: on) - streamLineThickness [0.0]
This parameter controls thickness of the streamline. 0 yields hair-line thickness, and larger value make the line thicker, but visualization time alsi increases. Suggested to use non-zero streamLineThickness in the analysis mode. The thickness is approximately ndiv times mesh size (ndiv is specified in the parameter). - nLoopStreamline [1]
This parameter is proportinoal to the number of iteraction calculations required for streamline visualization. By setting nLoopStreamline greater than 1, longer streamlines could be visualized. Computational cost also increases. - velocityEpsilon [0.01] [2023R3.0 or later]
Defines the minimum fluid velocity at which tracer particles and streamlines will be displayed. The minimum fluid velocity is defined as [velocityEpsilon] x [maximum flow velocity]; tracer particles and streamlines will not be displayed in regions below this fluid velocity. - minMaxFlag [0]
This parameter can also be modified by on the tool pane, and it controls whether calculation of max/min values include ghost/solid regions.
(0: off, 1: on) - scanningPixelWidthIBM [5]
This parameter controls the distance from the object surface towards the object center beyond which the region is no longer regarded as solid object. The optimal value of this parameter is approximately 5, and usually it does not need to be changed. - showGhostSolidFlag [0]
This parameter can also be modified by on the tool pane, and it controls visualization of ghost/solid regions.
(0: off, 1: on) - nonBcObjectColorFlag [0]
This parameter can also be modified by on the tool pane, and it controls colouring visualization object based on the current physical quantity.
(0: off, 1: on) - nonBcObjectColorR [15]
This parameter controls the "R" component of default color for stream line, velocity vector and particle in RGB. - nonBcObjectColorG [200]
This parameter controls the "G" component of default color for stream line, velocity vector and particle in RGB. - nonBcObjectColorB [230]
This parameter controls the "B" component of default color for stream line, velocity vector and particle in RGB. - showIsoSurfacesFlag [0]
Not implemented yet. - showCrosssectionXYFlag [1]
This parameter can also be modified by on the tool pane, and it controls visualization of XY cross-section.
(0: off, 1: on) - zCrosssectionXY [lz/2]
This parameter controls Z-location of the XY cross-section. - showCrosssectionYZFlag [0]
This parameter can also be modified by on the tool pane, and it controls visualization of XY cross-section.
(0: off, 1: on) - xCrosssectionYZ [lx/2]
This parameter controls X-location of the YZ cross-section. - showCrosssectionXZFlag [0]
This parameter can also be modified by on the tool pane, and it controls visualization of XY cross-section.
(0: off, 1: on) - yCrosssectionXZ [ly/2]
This parameter controls Y-location of the ZX cross-section. - showCrosssectionVectorFlag [1]
This parameter controls visualization of in-plane velocity vectors for XY, YZ, and ZX cross-sections.
(0: off, 1: on) - showHelpShortcutFlag [0]
This parameter can also be modified by on the tool pane, and it controls visualization of list of shortcut keys and mouse operation.
(0: off, 1: on) - dispQuantFlag [5]
This parameter can also be modified by the below buttons on the tool pane (and value is the list item number). Density
 U
U
 V
V
 W
W
 Velocity magnitude
 Temperature
 Mass fraction
 Pressure
- animationRotationFlag [0]
Specifying a non-zero (integer) value gradually rotate the camera position. The speed of rotation is propotional to the value. See example. - ndivDrawMeshForGraphic [0]
Not implemented yet. - bcAlphaSTL [255]
Transperancy of the CAD (STL) model (0-255). - bcAlphaUser [255]
Transperancy of the model constructed based on non-preset colors (0-255). - bcAlphaK [130]
Transperancy of the model constructed based on preset black colors (0-255). - manualMinFlag [0] [2019R2.1 or later]
A flag to manually set a minimum value in the color bar scale. 0:automatic, 1:manual. - manualMinValue [0.0] [2019R2.1 or later]
A manually set minimum value in the color bar scale. - manualMaxFlag [0] [2019R2.1 or later]
A flag to manually set a maximum value in the color bar scale. 0:automatic, 1:manual. - manualMaxValue [0.0] [2019R2.1 or later]
A manually set maximum value in the color bar scale. - cameraTheta0 [0.0]
The angle of the camera position in spherical coordinate. Mouse left-drag operation can control this parameter. - cameraTheta1 [0.0]
The angle of the camera position in spherical coordinate. Mouse left-drag operation can control this parameter. - cameraRadius [--]
The camera distance from the target in spherical coordinate. Mouse scroll operation can control this parameter. - cameraPosX [0.0]
X-position of the camera. Mouse right-drag operation can control this parameter. - cameraPosY [0.0]
Y-position of the camera. Mouse right-drag operation can control this parameter. - cameraPosZ [--]
Z-position of the camera. Usually, there is no need to specify this. - cameraTargetX [0.0]
X-position of camera target. - cameraTargetY [0.0]
Y-position of camera target. - cameraTargetZ [--]
Z-position of camera target. Usually, there is no need to specify this. - cameraPerspectiveDeg [60.0]
Perspective angle of the camera. - colormapFlag [0]
A flag for colormap. There are five different colormaps to choose. You can also click the displayed color bar during the simulation to change the colormap. 1. Rainbow
 2. Nishiki
 3. Hot
 4. Grey scale
 5. Grey scale (inverted)
- probeRecordInterval [10]
Frequency of the probe measurement. The probe measurement is performed once in every probeRecordInterval steps and measured values are stored in the files. - numProbes [0]
Number of the probe currently used in the simulation. No need to change this value manually. - forceRecInterval [10] [2020R2.0 or later]
Frequency of the output of the hydrodynamic force measurement results. The output is performed once in every forceRecInterval steps. - showForce [0] [2020R2.0 or later]
This parameter can also be modified by on the tool pane, and it controls the computation of hydrodynamic forces.
(0: off, 1: on) - numRecForce [0] [2020R2.0 or later]
Number of the objects for which the hydrodynamic forces are currently computed. No need to change this value manually. - heatLossRecInterval [10] [2021R1.0 or later]
Frequency of the output of the wall heat loss measurement results. The output is performed once in every heatLossRecInterval steps. - showHeatLoss [0] [2021R1.0 or later]
This parameter can also be modified by on the tool pane, and it controls the computation of wall heat losses.
(0: off, 1: on) - numRecHeatLoss [0] [2021R1.0 or later]
Number of the objects for which the wall heat losses are currently computed. No need to change this value manually.