The Easiest Computational Fluid Dynamics Software
 JP
JP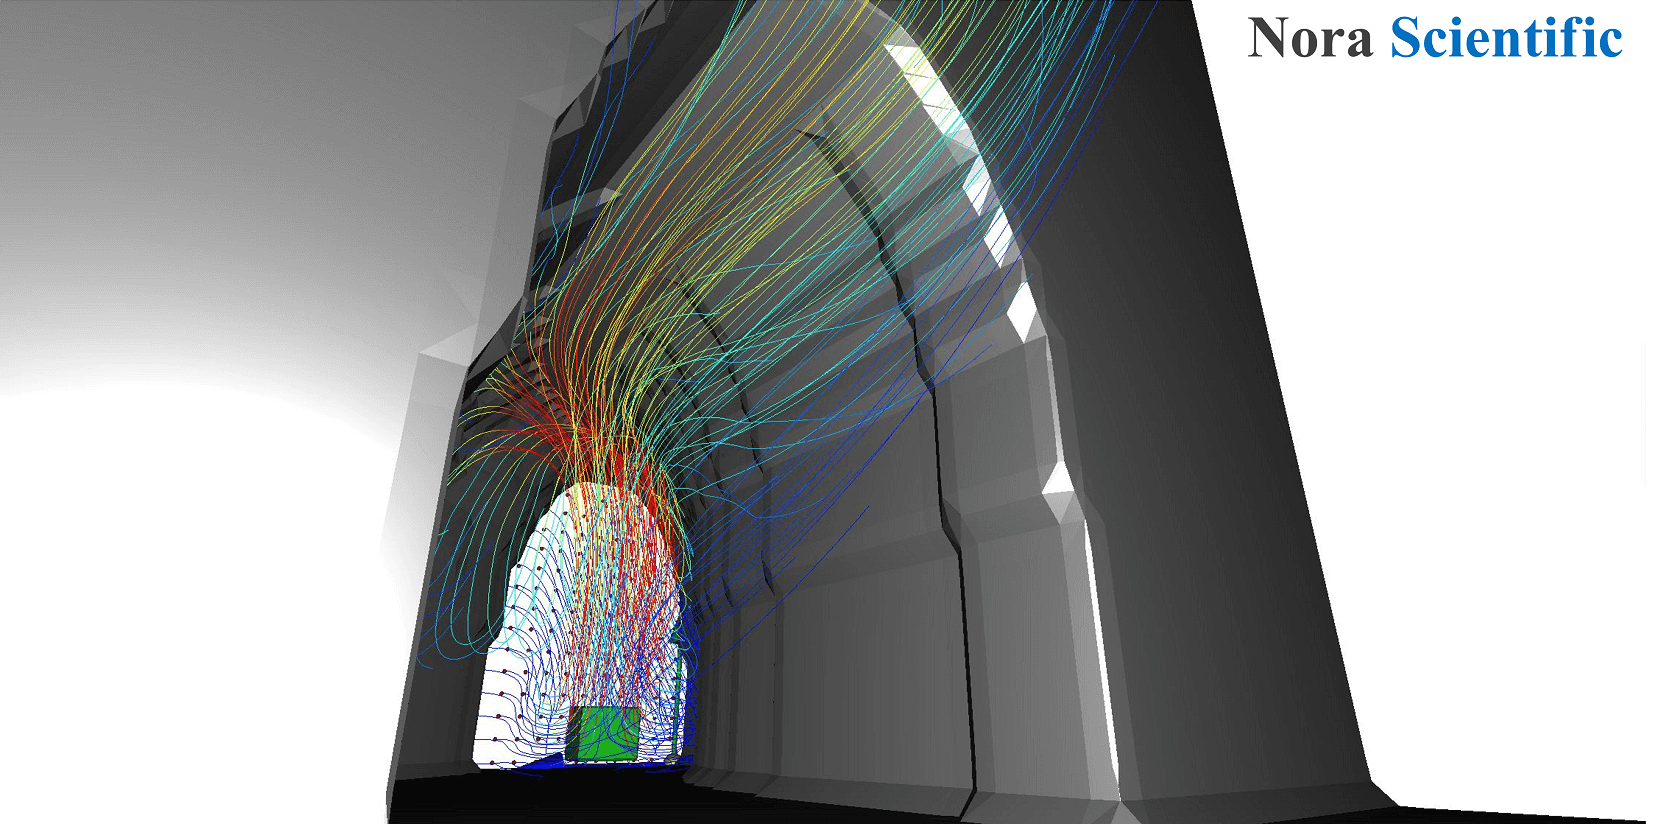
Hot gas flow in a tunnel
1. Introduction
Model subtraction is useful for building relatively complex flow channel. In this tutorial, we will examine how hot gases flow when a source of hot gases (e.g., fire) is present in a meandering tunnel under a variety of tunnel flow velocity conditions.
Fluid upstream of the tunnel flows uniformly in the x direction at a constant velocity. The velocities considered here are 0.1 m/s, 0.2 m/s, and 0.4 m/s. The ambient gas flows in from the upstream side of the tunnel, and the temperature of the ambient gas is 300K. The source of the hot gas is located on the ground upstream of the tunnel, where the fluid is heated to 600K.
This tutorial will illustrate model subtraction through such a simulation. You can download all the input files necessary to run the simulations presented.
Input files
- param.txt
- bcXY0.bmp
- bcXY1.bmp
- bcYZ0.bmp
- bcYZ1.bmp
- bcZX0.bmp
- bcZX1.bmp
- bmp.txt (*Automatically generated file, unnecessary if the following boundary construction rules are specified manually)
This simulation has a computational cost of about 1 minute for 1000 steps on a typical high-end PC, using a parallel level of "parallel = 3" (see parameter setting).
2. 3D model construction
Please refer to this page page for the basic construction rules in creating a 3D model. The first step in the construction process is to create bitmap images for each element.
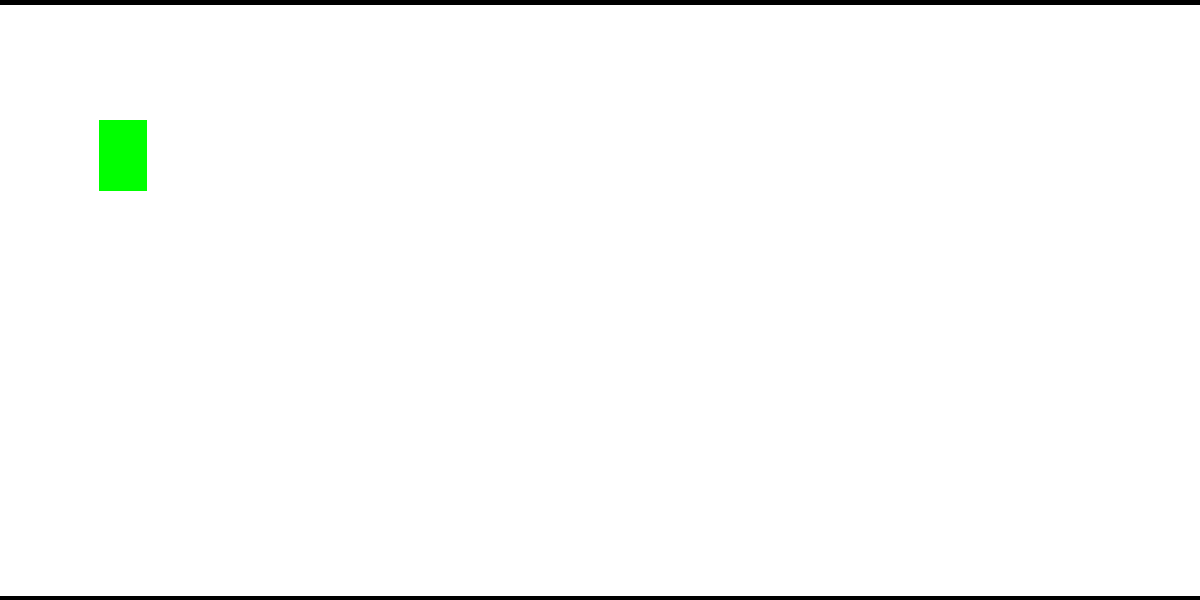
The figure below shows bitmap images for boundary conditions and their orientation within the simulation domain.
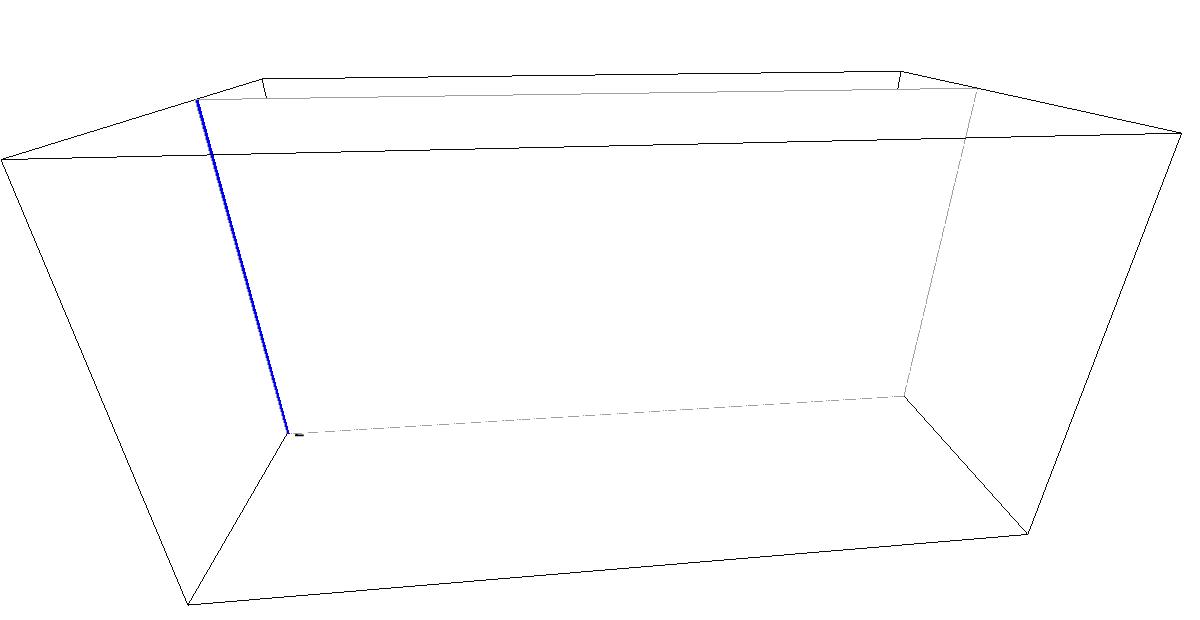
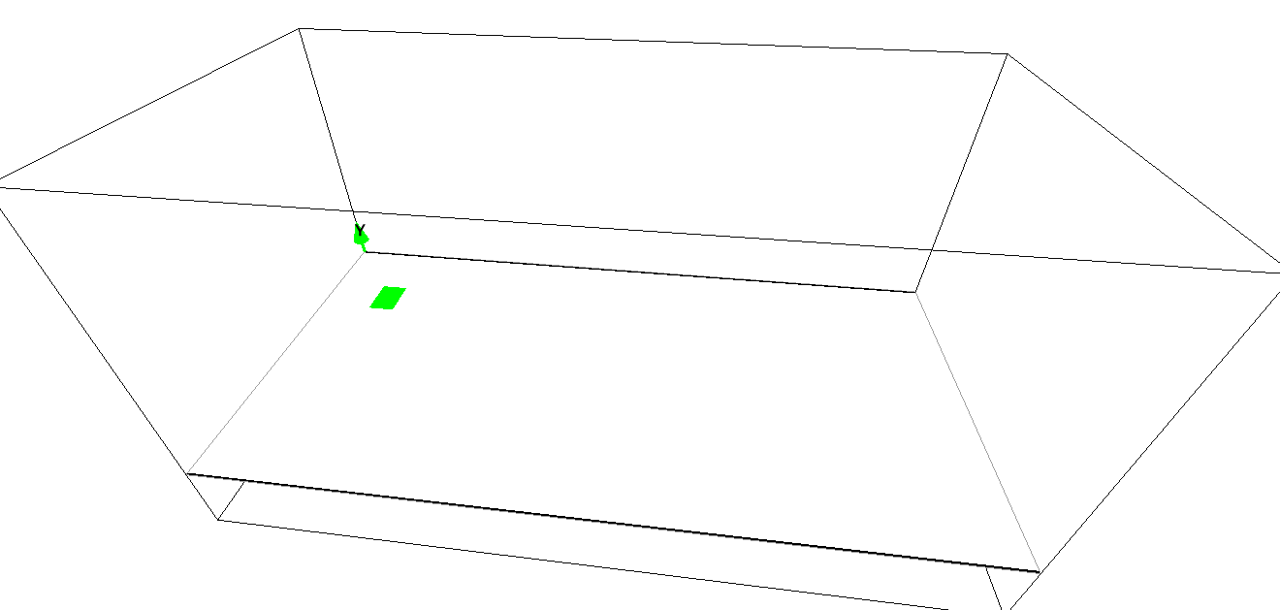
Preset and non-preset colors are used to define the meandering tunnel, hot gas generating objects, inflow boundaries, etc., in these bitmap images for defining boundary conditions.
Preset colors- ■ Upstream of the tunnel, positive x-directional inflow boundary
- ■ Hot gas generating object (temperature boundary without fluid velocity constraints)
- ■ Auxiliary wall boundary
- ■ Ground surface
- ■ Object to be subtracted by a tunnel-shape object
- ■ tunnel-shape object to subtract.
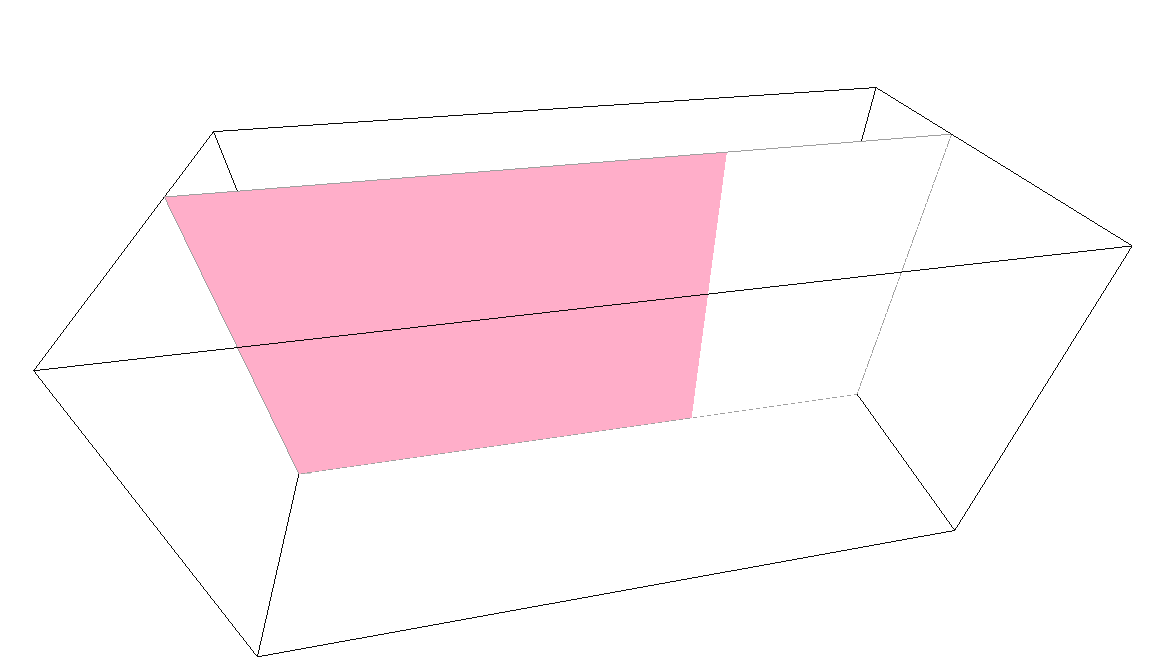
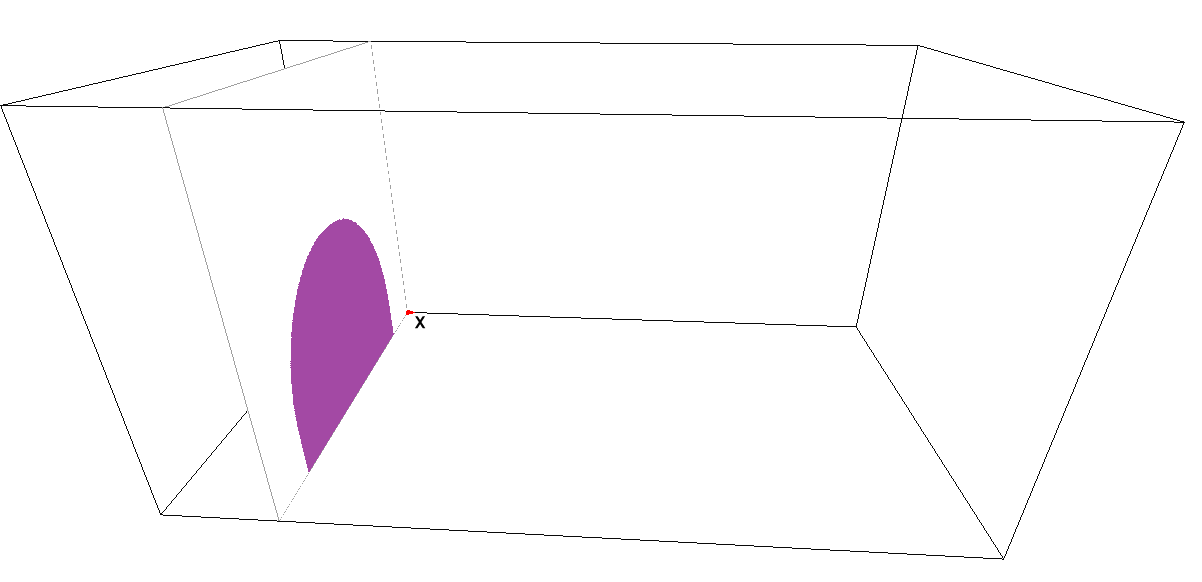
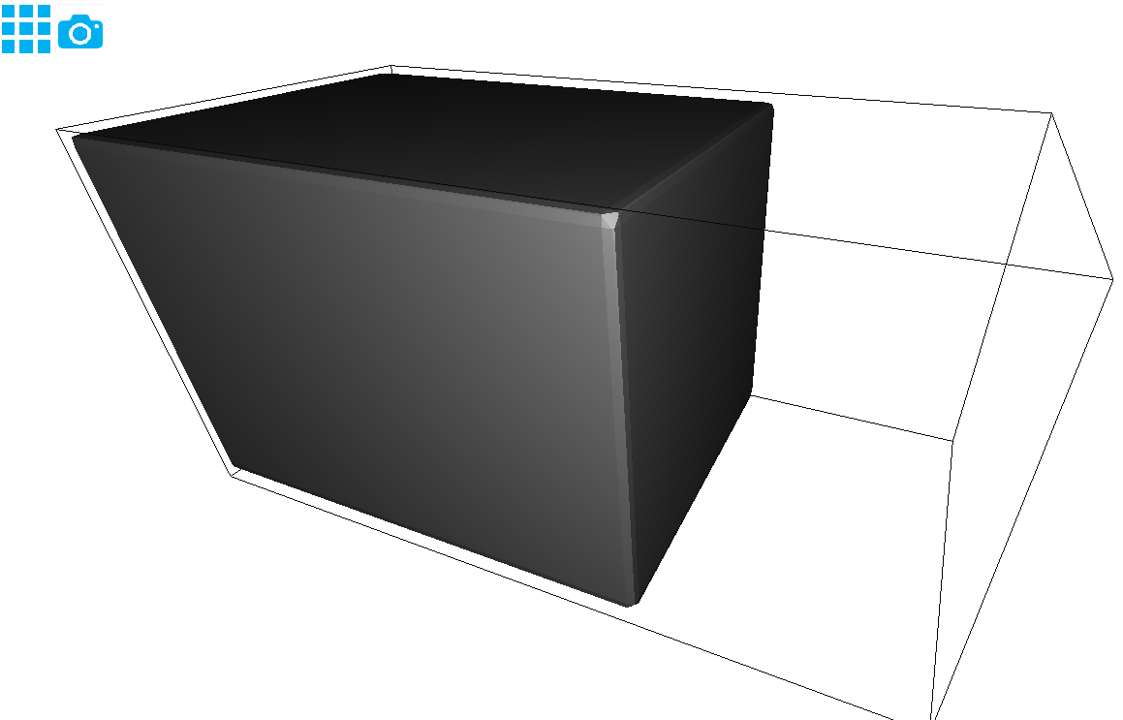
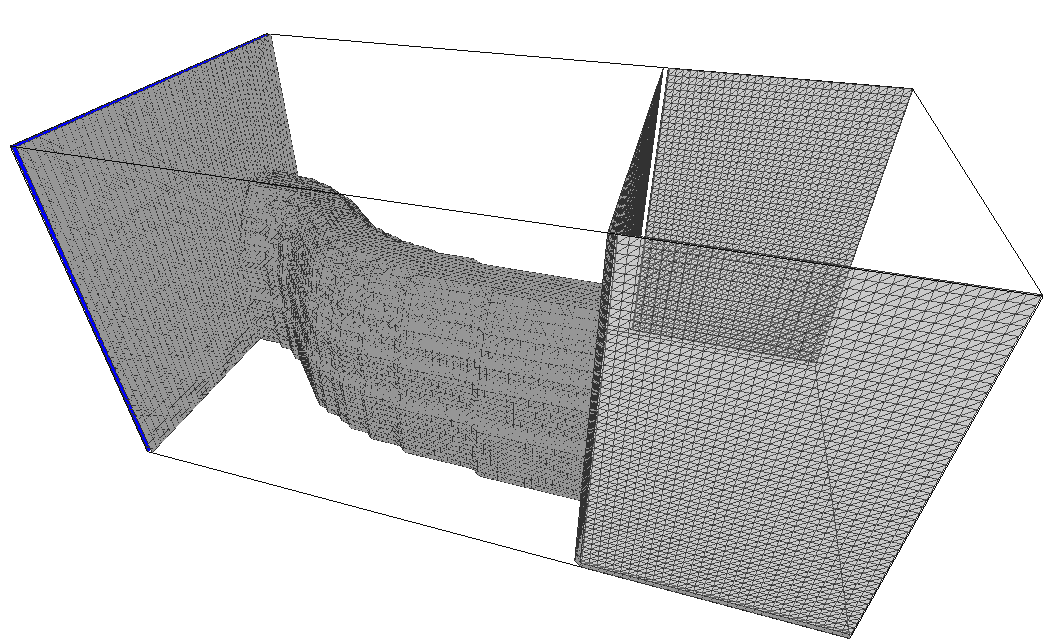
The following is a description of the boundary condition colors ■ and ■ for the subtraction process. ■ creates a large rectangular shape that fills most of the upstream side (left side of the image). ■ creates a meandering tunnel shape (solid, not hollow). Subtracting the solid tunnel shape from this rectangle constructs the (hollow) tunnel channel.
The rectangle constructed with the non-preset boundary condition color ■ is geometrically subtracted by the solid tunnel shape constructed with the other non-preset color ■, resulting in the hollow tunnel shape shown on the right in the figure below.
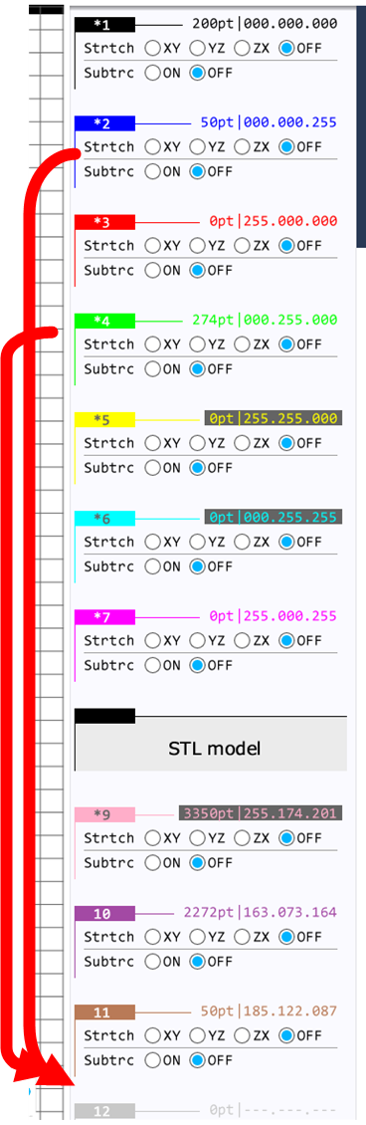
Boundary construction rules for each color, such as stretching and subtraction, can be set on the "boundary configuration image loader" screen as follows.
In the present simulation, we first apply "stretching" in the YZ directions to the object specified by the non-preset color ■ to define a meandering tunnel (solid medium). In other words, a smoothly meandering tunnel is constructed by stretching the shape described by ■ in bcYZ0.bmp in the YZ directions as appropriate to the shape specified in bcZX0.bmp.
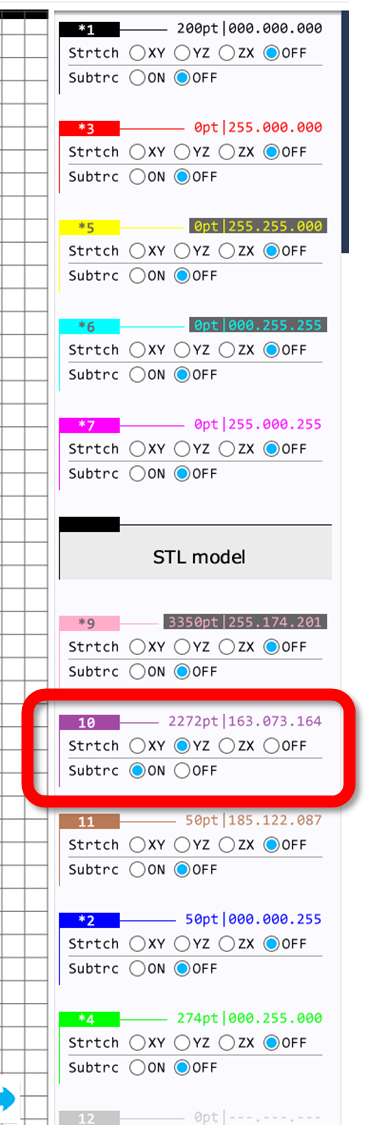
Next, we change the order of boundary condition construction. The boundary conditions are constructed in the order of the colors from the top to the bottom colors in the color list. This time, the solid tunnel shape needs to be subtracted last, but after the subtraction, the inflow boundary condition defined by ■ and the hot gas generating object defined by ■ need to be constructed (because otherwise all these objects will also be subtracted).
In other words, we move ■ and ■ below the boundary condition color to be subtracted. You can do so by dragging and dropping the color cards.
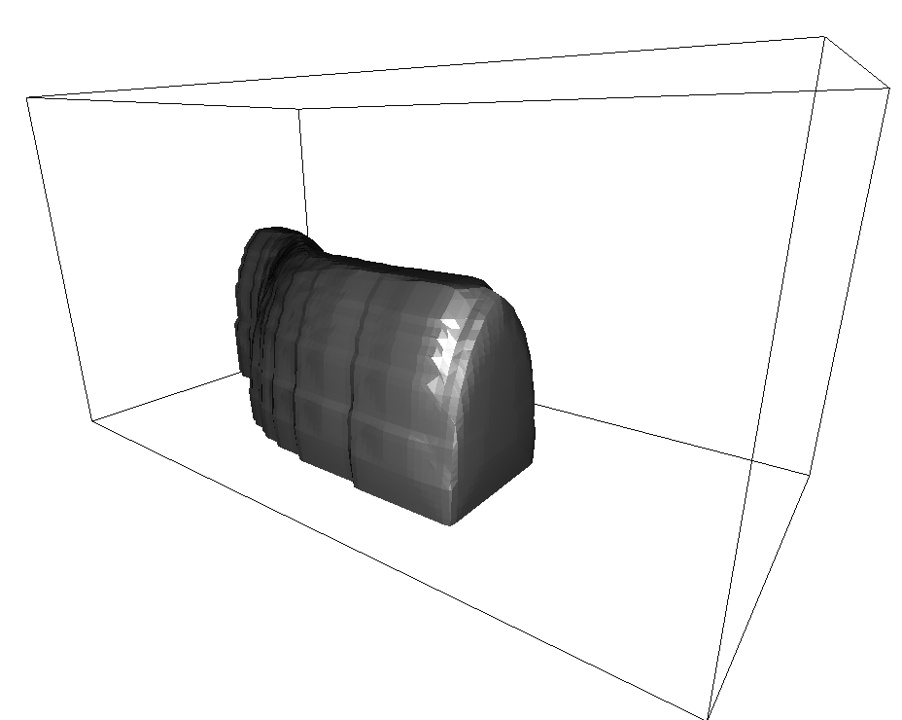
BEFORE and AFTER the above operations (stretching and ordering) are shown in the figure below.
Note that these operations can be applied automatically by placing the bmp.txt file, which can be downloaded from this tutorial, in the input directory of the project.
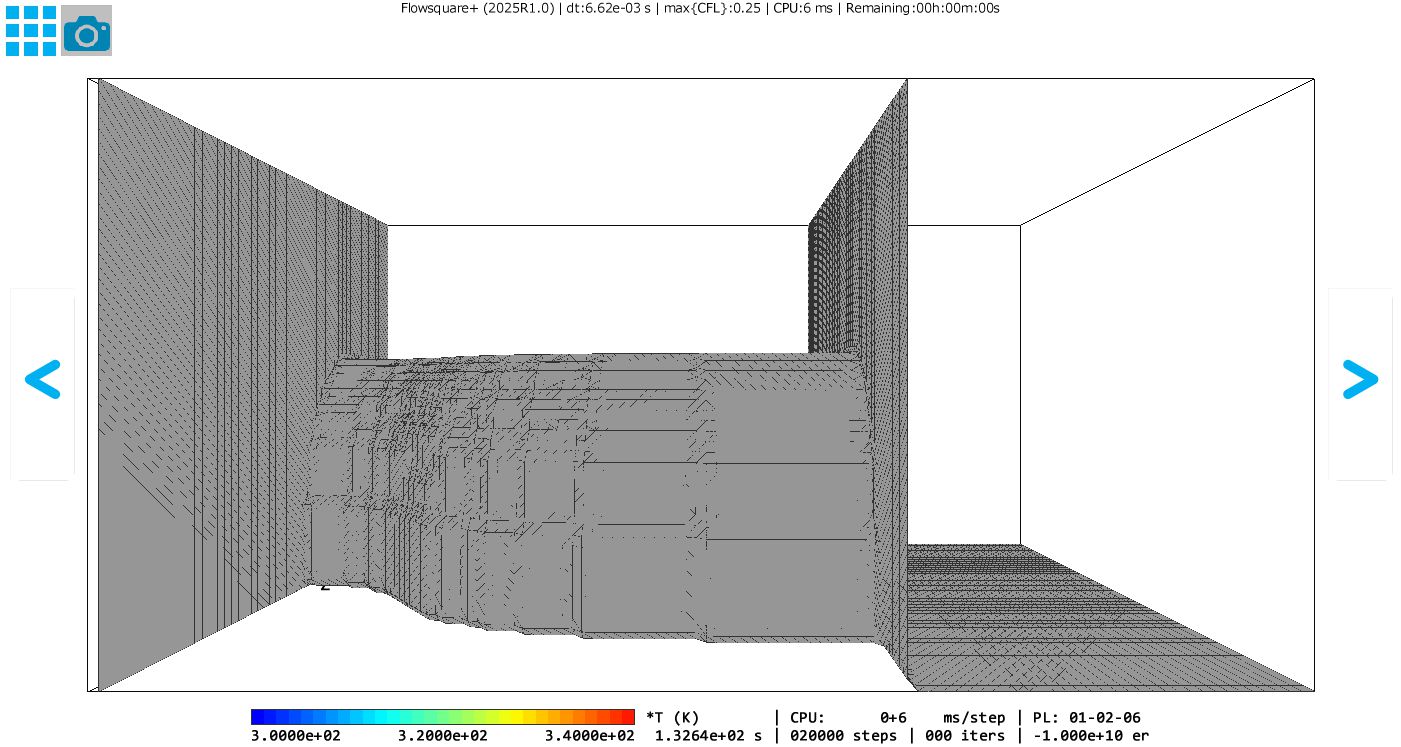
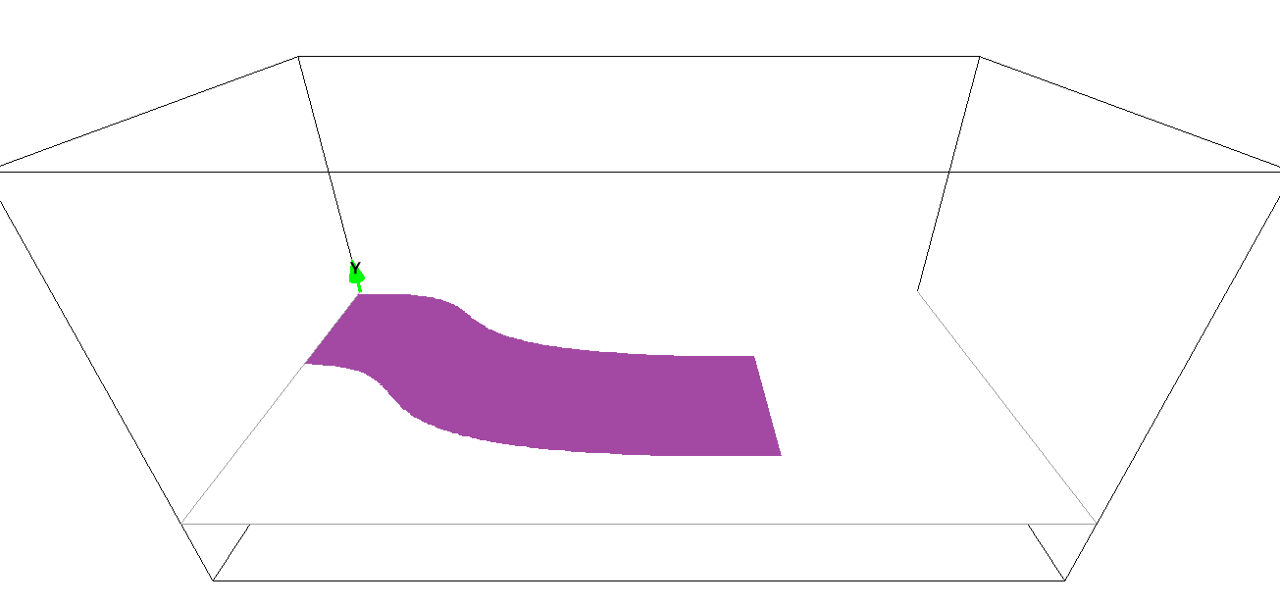
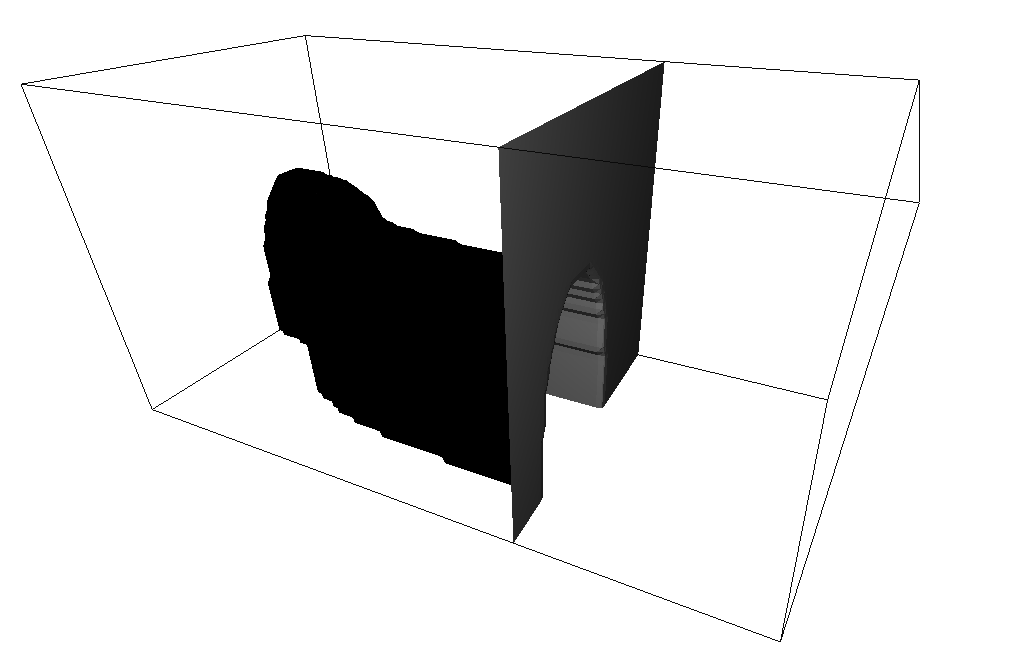
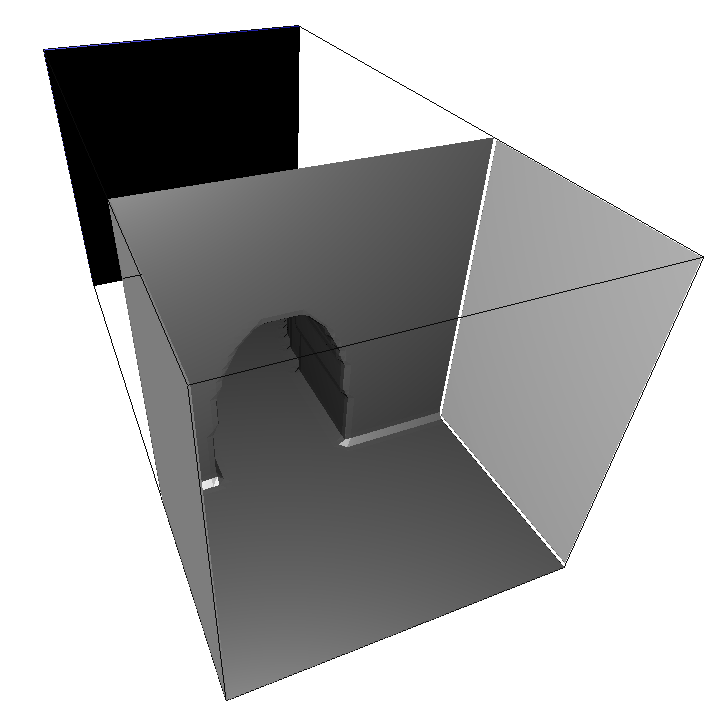
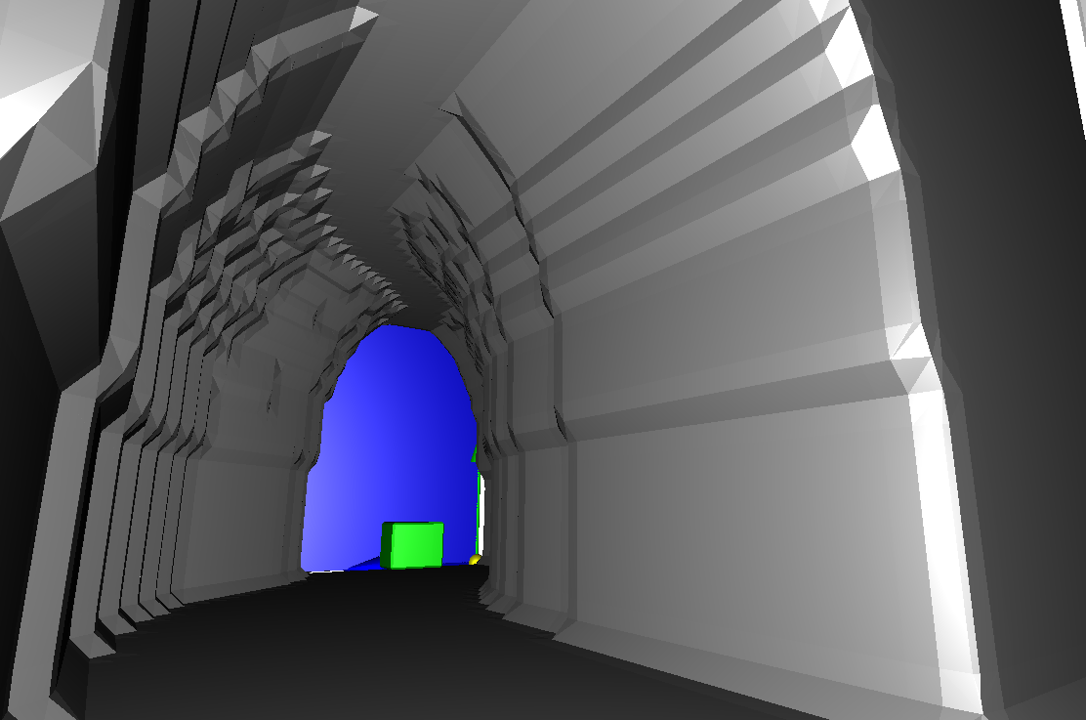
Finally, the meandering tunnel, hot gas generating object, and tunnel upstream inflow boundary constructed from the bitmap images for these boundary conditions are shown below.
3. Input parameters
The following describes parameters of particular importance in this simulation. For a description of general calculation parameters, please click here.
- cmode
1: Select the thermohydrodynamic mode with cmode=1 and consider the condition with temperature fluctuation. - lx, ly, lz
Simulation domain sizes in x-, y-, and z-directions are 10.0 m, 5.0 m, and 5.0 m, respectively. - nx, ny, nz
The number of lattice points in the x, y, and z directions is determined by considering the required spatial resolution and computational resources. In this tutorial, (nx, ny, nz) = (100, 50, 50). - uinB, vinB, winB
From the blue boundary, positive inflow in x direction. vinB, winB consider default values (=0). In this tutorial, (uinB, vinB, winB) = (0.1, 0, 0) m/s is used as a basis, and uinB = 0.2 m/s and 0.4 m/s are also considered separately for discussion. - uinG, vinG, winG
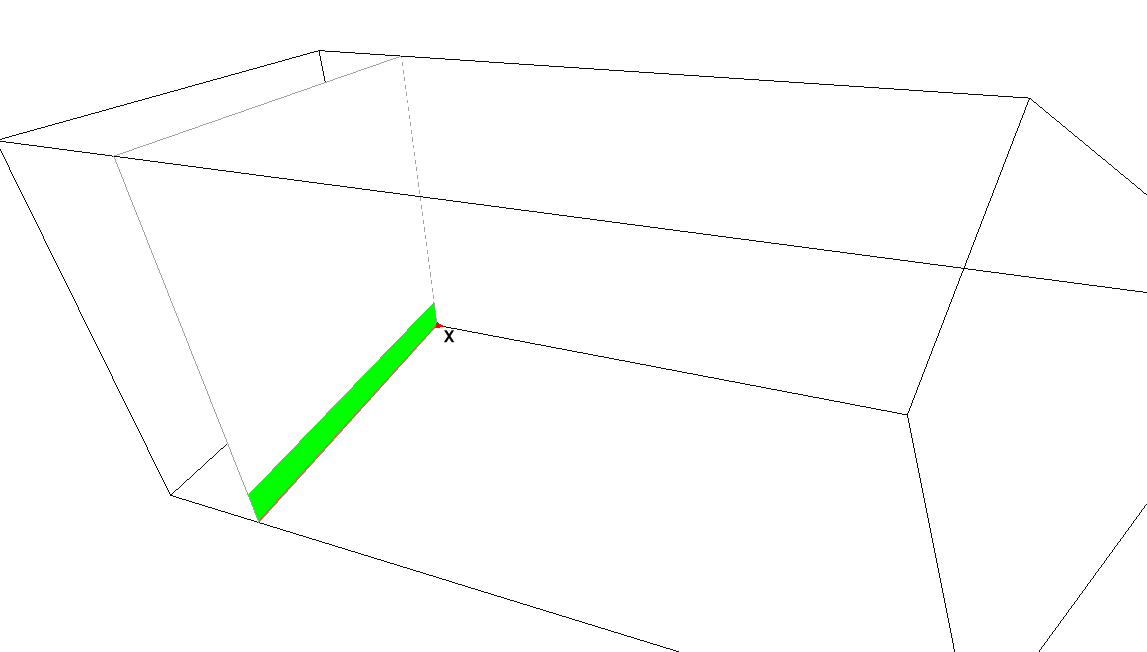
At the green boundary, the flow velocity is not constrained. That is, (uinG, vinG, winG) = (-, -, -) m/s. - tempG
The temperature on the green boundary is 600 K. Other temperatures (initial temperature, blue boundary temperature) are default values (=300 K). - mu
The viscosity coefficient of air is specified as 2.0E-5 (kg/m/s). - gfy
Gravitational acceleration as external force in Y direction to account for buoyancy. -9.8 m^2/s.
4. Simulation results
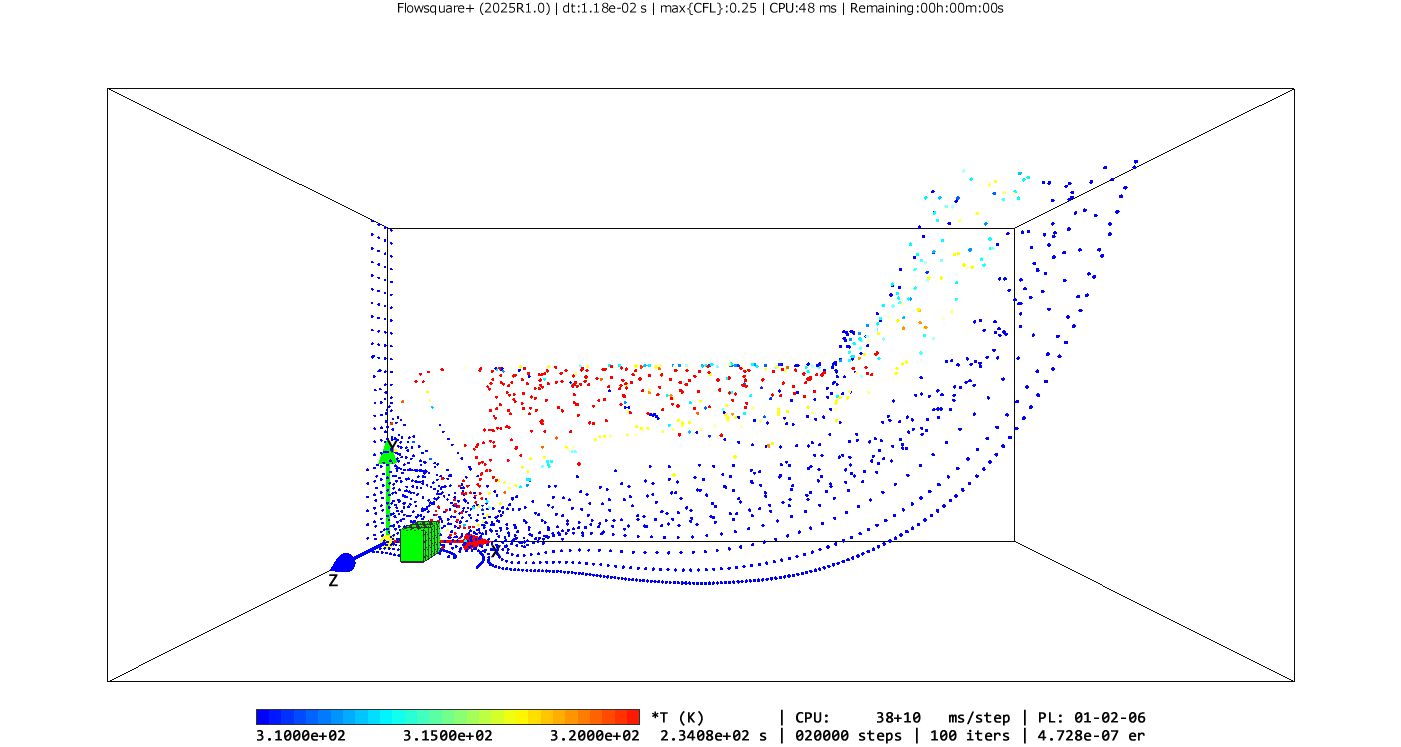
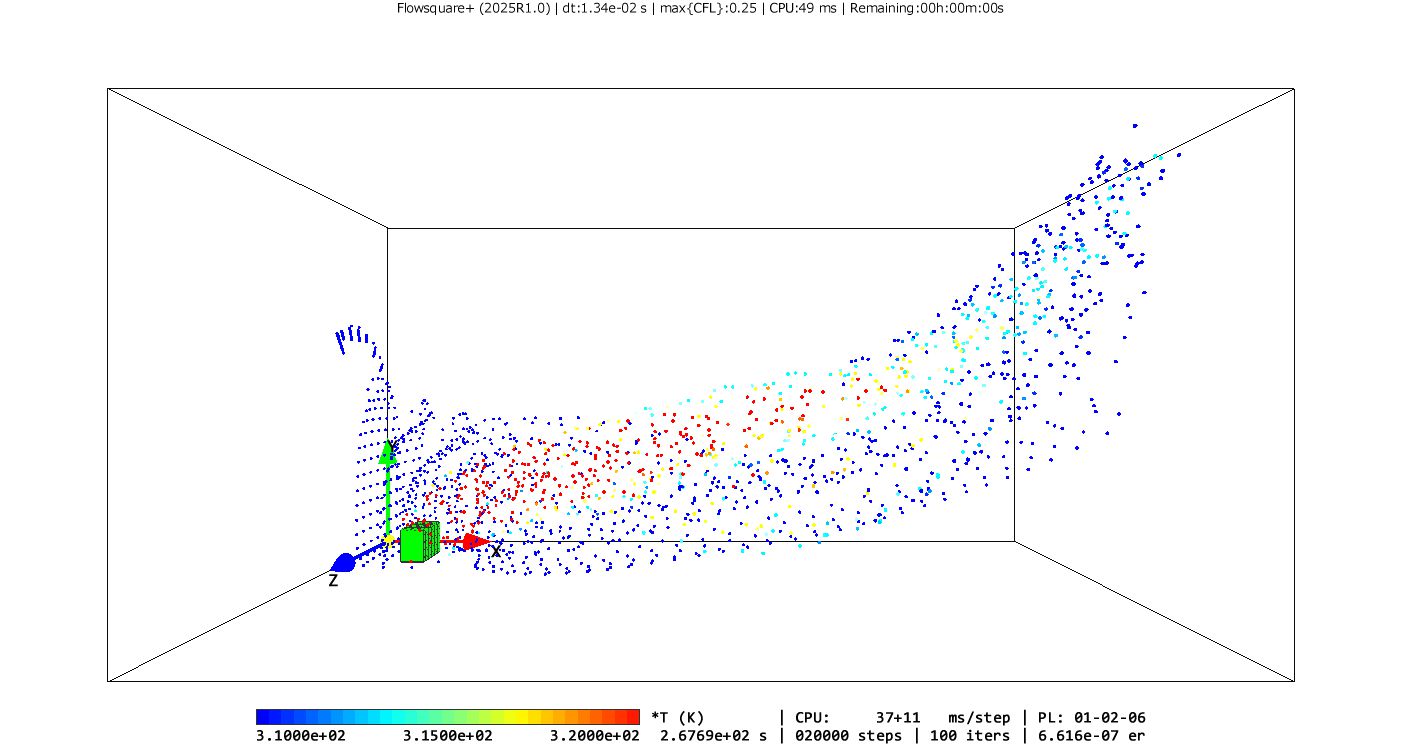
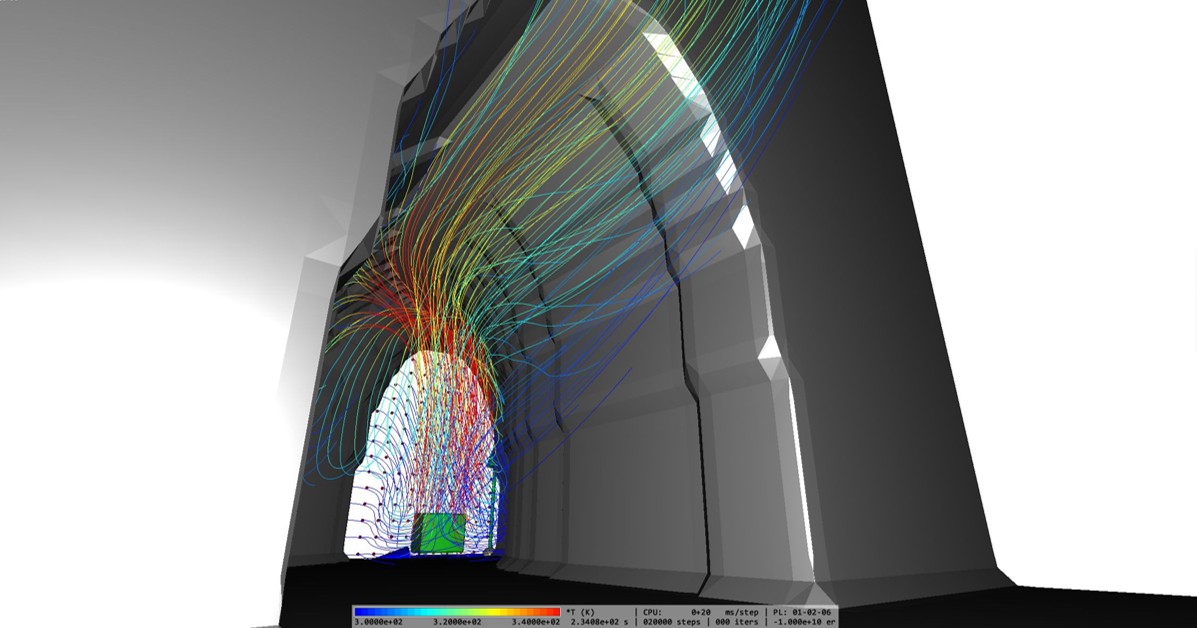
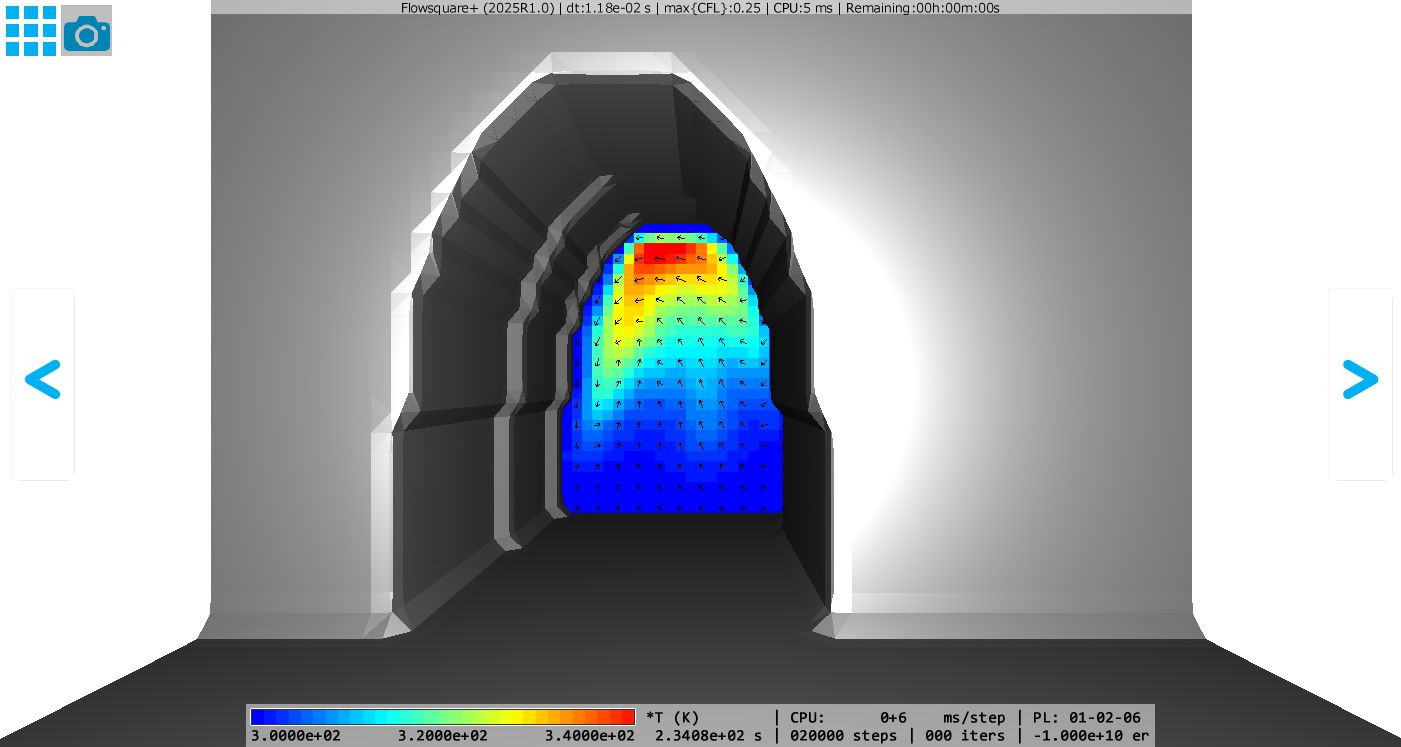
The results of running Flowsquare+ with this simulation input file are shown below. It is observed that the high-temperature gas and the resulting warmed ambient gas are more present at the top of the tunnel due to buoyancy. With increasing uniform flow velocities in the tunnel, such hot fluids are shown to be discharged before convection in the upper part of the tunnel.
本シミュレーション入力ファイルでFlowsquare+を実行した場合の結果は以下の通りです。浮力によって高温ガスやそれに暖められた周囲気体は、トンネル上部に多く存在している様子が観察されます。また、一様流流速の増加と共に、そのような高温流体はトンネル上部に対流する前に排出される様子が示されています。
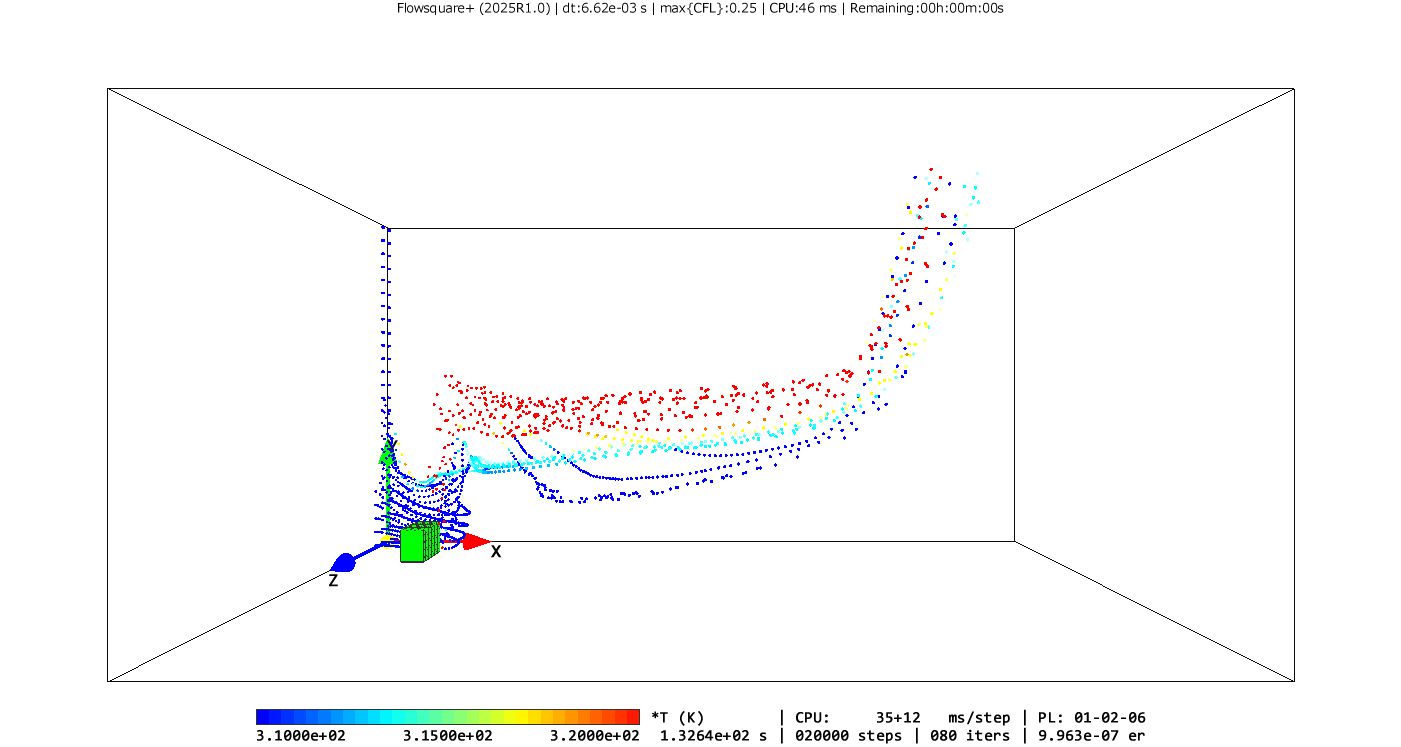
Uniform flow velocity of 0.1 m/s in the tunnel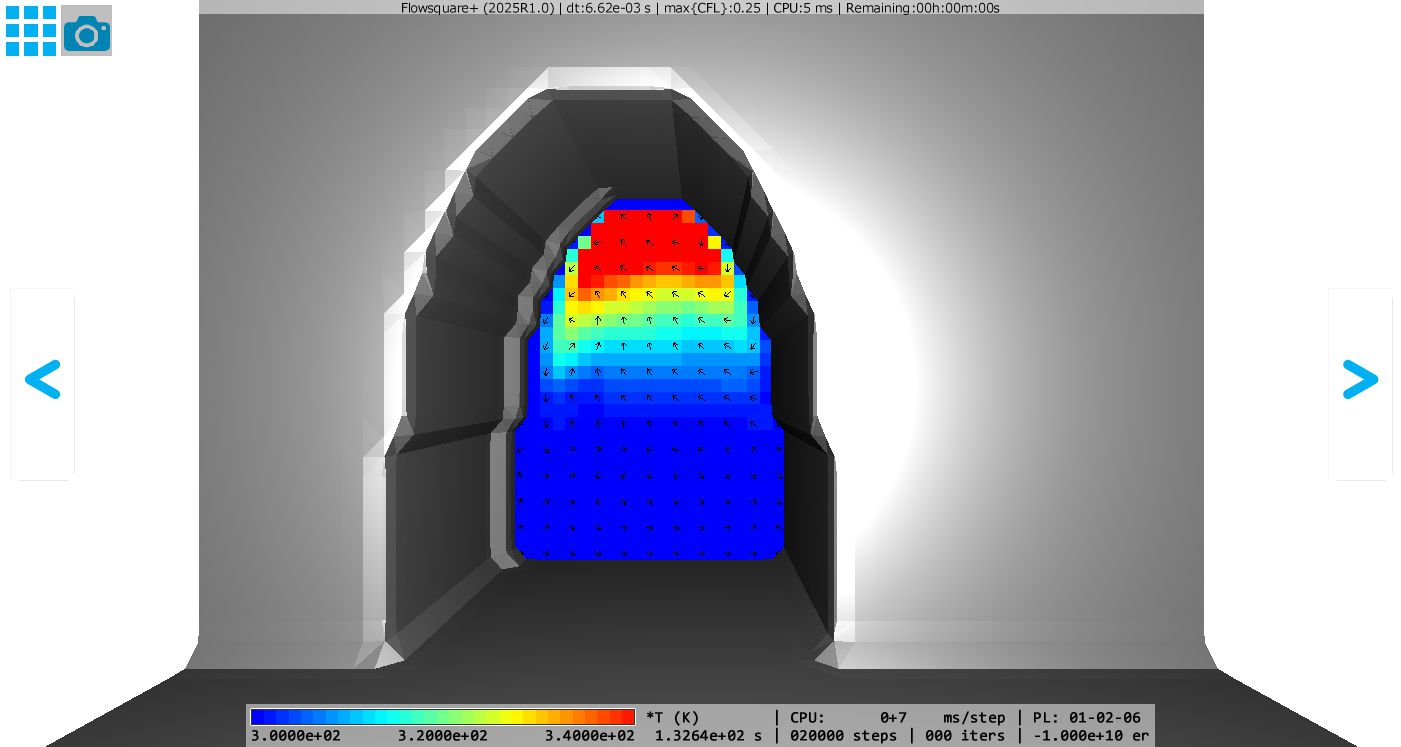
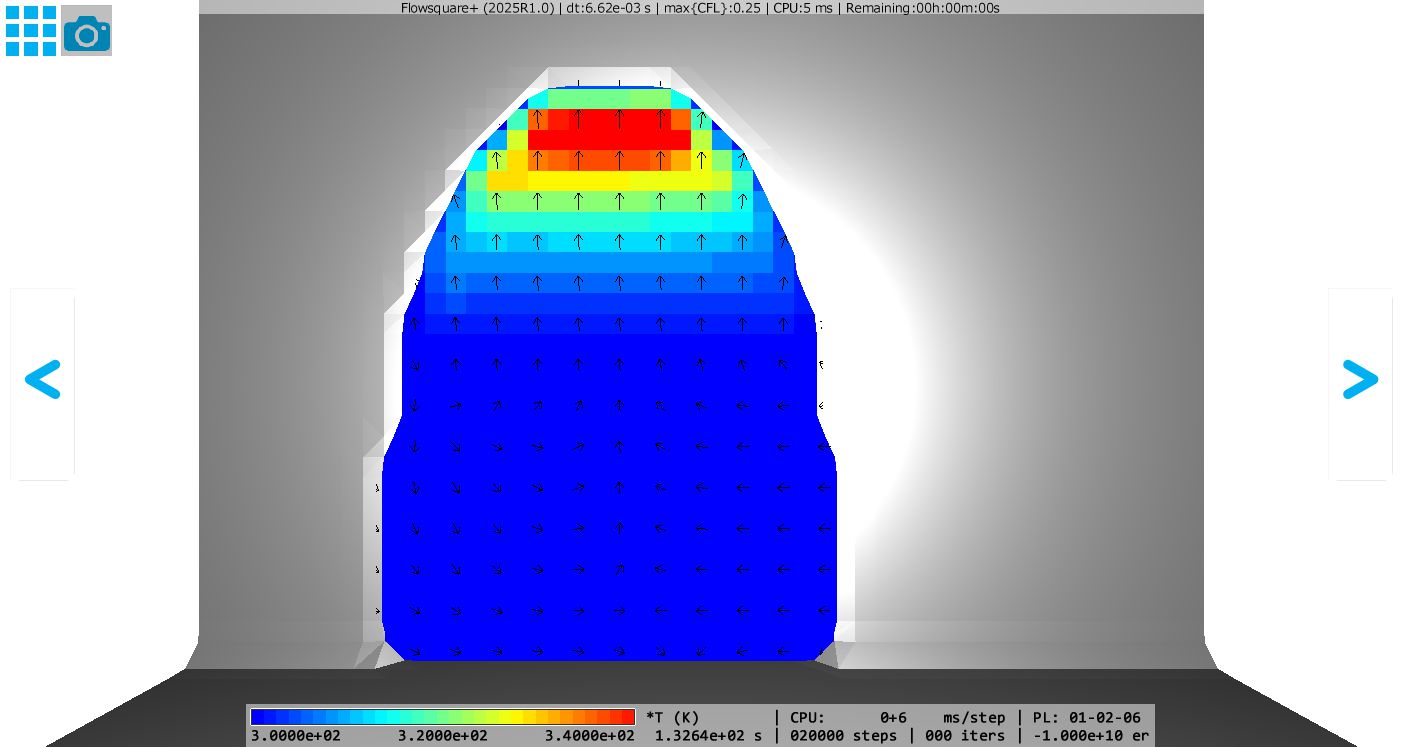
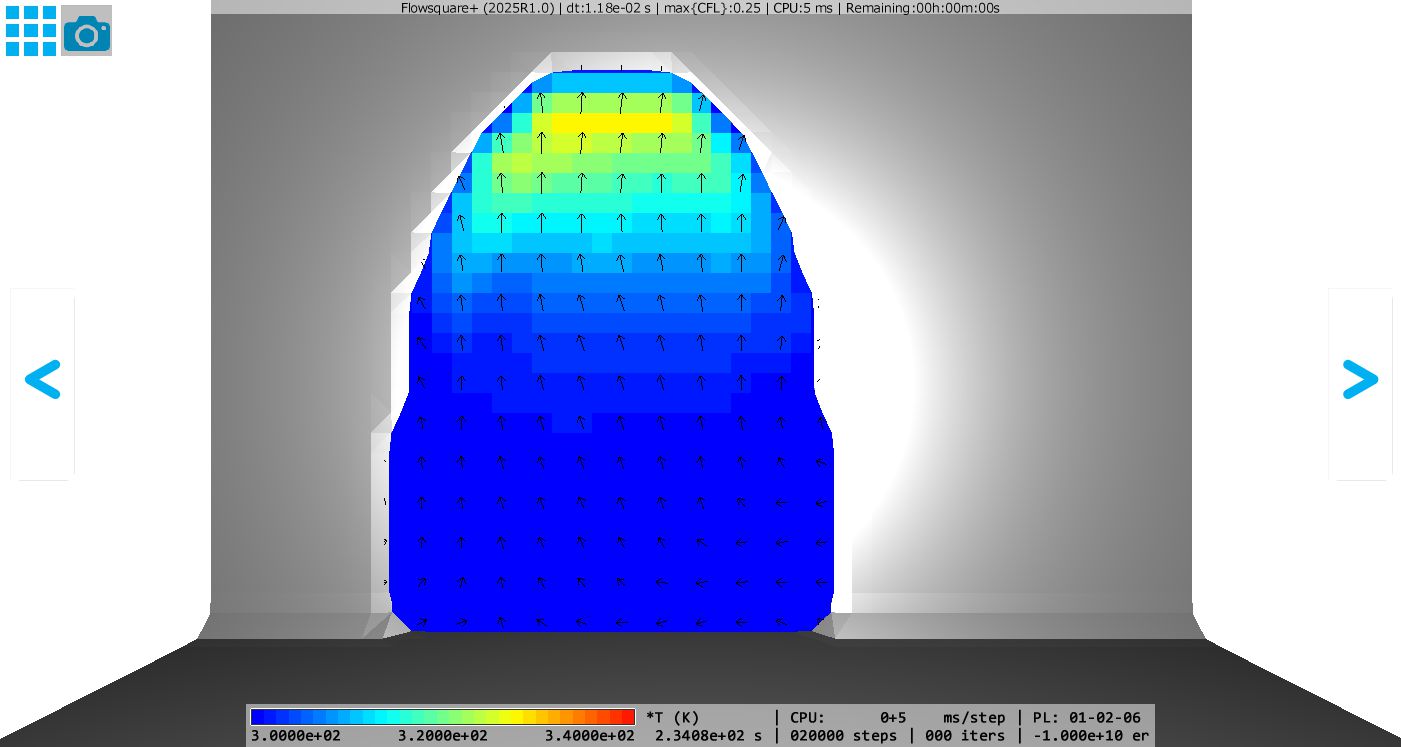
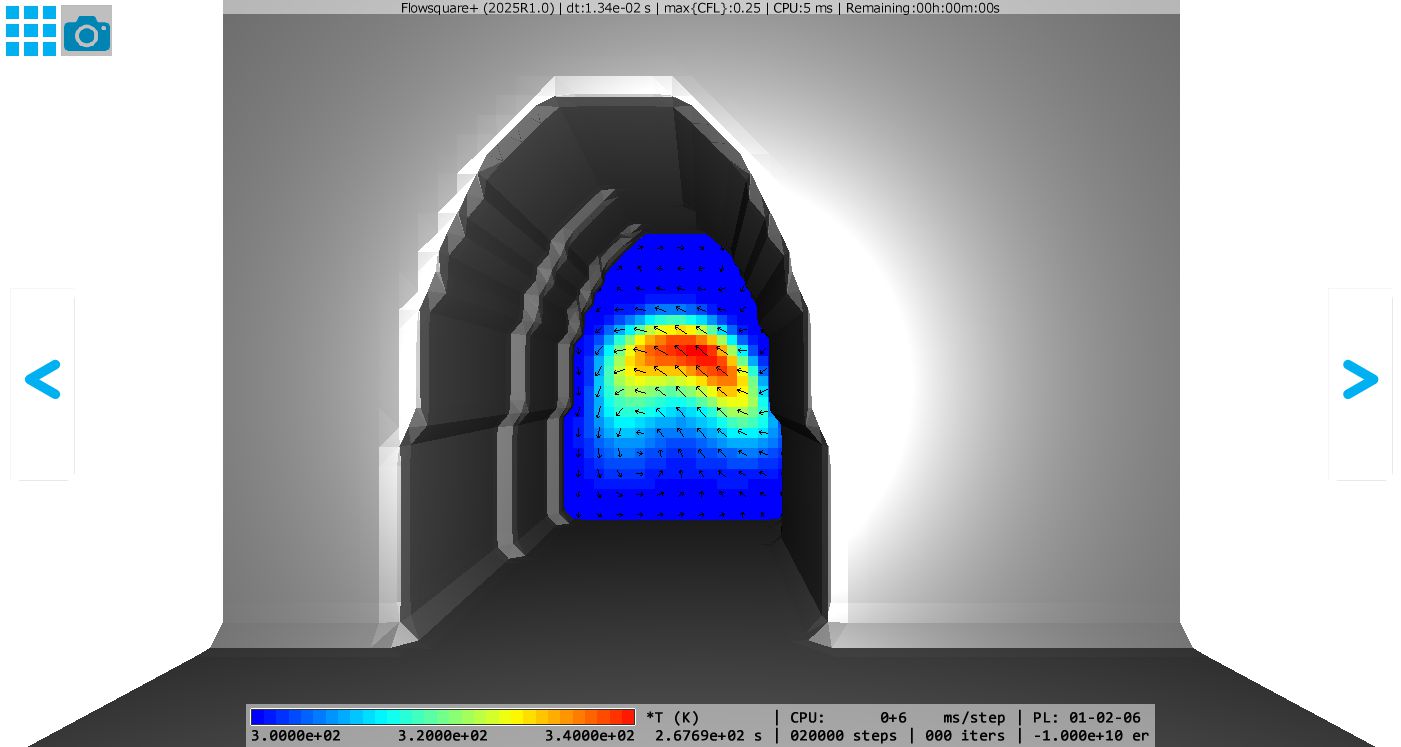
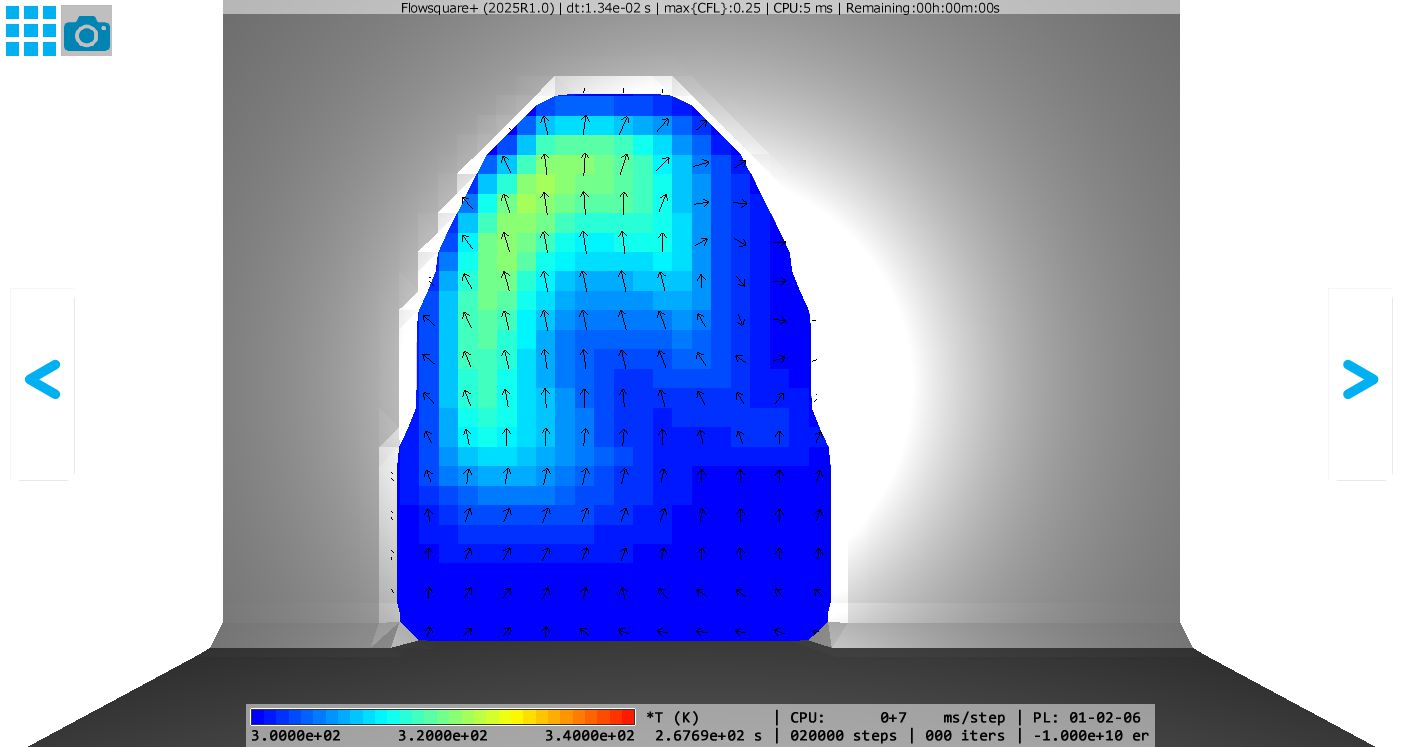
The figure below shows an example of visualization using tracer particles. The colors of the particles indicate the temperature at the location of each particle. Blue indicates relatively low temperature and red indicates high temperature.
For a flow velocity of 0.1 m/s, the fluid temperature in the tunnel is almost completely hierarchical, with a clear layer of hot fluid at the top and cold fluid at the bottom. On the other hand, under higher velocity conditions, the hierarchy of fluid temperature is not as complete due to the local mixing that results from the higher velocity, indicating the presence of low-temperature fluid in the upper part of the tunnel as well.